Cold Creek
About
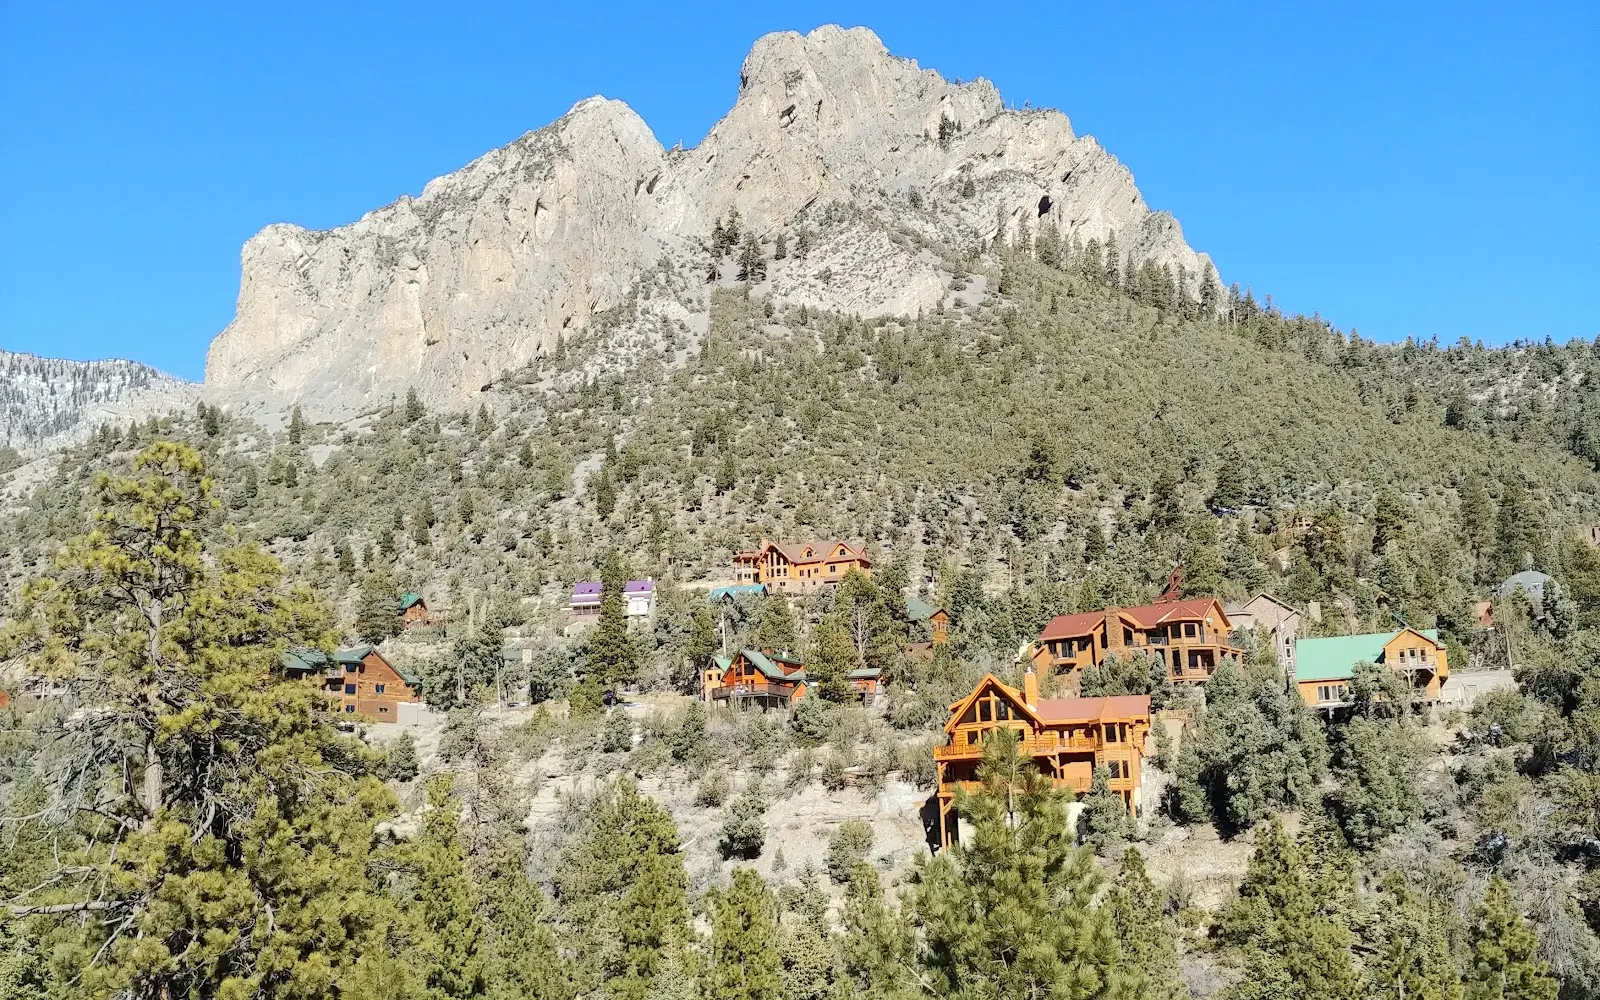
Gallery
Community details
- Climate
- High desert
- Infrastructure
- Solar, Well, Septic
- Amenities
- Shared roads
- Parcel data
- Clark County (NV) Assessor/GIS (https://maps.clarkcountynv.gov)
Around here
Around Cold Creek
Temperature from a 1980 federal survey. The record says nothing about access, ownership or current conditions.
Data Source: Recreation.gov · Source: USGS GNIS · Thermal springs: NOAA NCEI (1980) · Public land: USGS PAD-US
Typical flow by month
1985 to 2026
The water at Cold Creek typically runs highest in December, at a median 0.3 cfs, and lowest in May, at 0.3 cfs. The highest flow on record for any single day is 0.5 cfs, in 2018.
Show the numbers
| Month | Typical (cfs) | Usual range (cfs) |
|---|---|---|
| January | 0.3 | 0.3 to 0.3 |
| February | 0.3 | 0.3 to 0.3 |
| March | 0.3 | 0.3 to 0.3 |
| April | 0.3 | 0.3 to 0.3 |
| May | 0.3 | 0.3 to 0.3 |
| June | 0.3 | 0.3 to 0.3 |
| July | 0.3 | 0.3 to 0.3 |
| August | 0.3 | 0.3 to 0.3 |
| September | 0.3 | 0.3 to 0.3 |
| October | 0.3 | 0.3 to 0.3 |
| November | 0.3 | 0.3 to 0.3 |
| December | 0.3 | 0.3 to 0.3 |
Typical is the median of each month’s daily median values, and the usual range runs from the median 25th to the median 75th percentile, across about 39 years of record. Statistics published by the US Geological Survey for Corn CK Spgs at National Fish & Wildlife Hdqrs, NV (site 09419625). Conditions on any given day can fall well outside the usual range. Check the current reading before you go.
Current conditions
Today · Fri
CloudyHigh 39°F, low 31°FRain 8%Wind 20 kt, gusts 27
Streamflow
0.4 cfs
Much above normal (95th)
Water level
2.61 ft
Air quality
4 Good
Linda monitor, 27 km
Forecast from Open-Meteo global models (NOAA & ECMWF). Air quality: Nevada Division of Environmental Protection via EPA AirNow. Preliminary data, not verified.
More communities
Also nearby
Other ways to get outside within about an hour of here.

Free tools